Display Quality Attributes
You want to display the quality attribute for the data point at the time of the measured value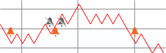 .
.
- Select the series for editing from the legend for the Trend View.
- Click Properties
 .
. - Click the Series Properties tab.
- Select the Show quality icons check box.
- Click Save
 .
. - Click Stop
 .
.
- Interventions or states that are not normal display with the corresponding quality attribute, for example,
 (see Quality Attributes).

NOTE:
The quality attributes are hidden when you re-click Run and the trend series is updated. You must select Advanced display if chart stopped in the Chart Properties tab (acts on all series) if you want to display quality attributes during update. If there are too many symbols, the update to the Trend View can take some time.
With the reduced display  , not all quality attributes can display. In order to display all quality attributes, limit the time period.