Event List
The Event List window displays all the detected events with each one on a separate row. This window is your main starting point for dealing with events. For instructions, see the step-by-step section.
When opened, Event List displays in the main work area of the user interface. When it is closed, depending on the Client Profile Event List may be either entirely hidden or collapsed to a vertical bar down the left side of the screen.
The display of Event List is limited to 10000 event lines; if such limit is exceeded, the status bar of Event List will indicate the display limit and the total number of events detected (for example, 10000 of 50000).
Event List Workspace
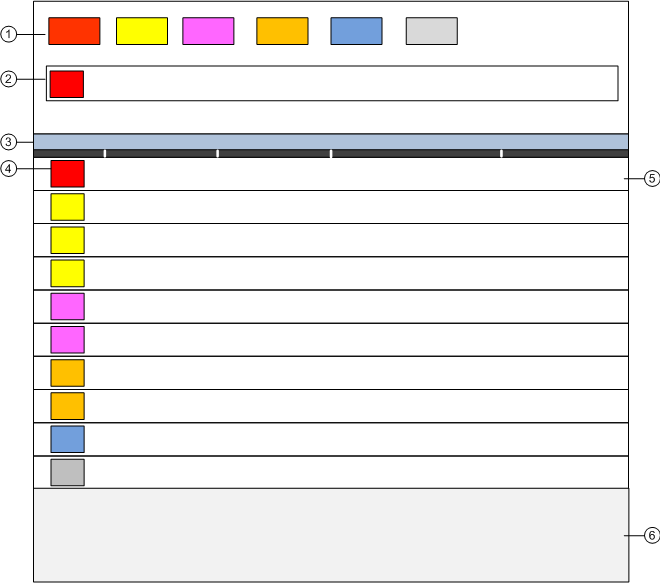
1 | Summary bar | Contains a set of event lamps that provide an overview of the events in the system. For more details, see Event Lamps and Summary Bar. |
2 | Event Detail bar | In some configurations, prominently displays an event that requires immediate attention across the top of the screen. |
3 | Title bar | Depending on what you select, the title bar of the Event List window shows:
It also contains some icons to open/close the Contextual pane (6), and depending on the Client Profile, lock the layout and restore down the window. |
4 | Event button | Graphic indicator of an event in the system. For more details, see the reference section. |
5 | Event descriptor | Contains the event button, event details and event-handling commands for the event currently being processed. For more details, see the reference section. |
6 | Contextual pane | Hidden by default. When open, it provides additional information, actions, and resources about the object that issued the event. The following tabs are available:
|
A contextual menu becomes available when you right-click the Event List column headers and provides you with options to customize the columns that display in Event List, and to print out the whole list of events.
Events in Distributed Systems
In distributed systems, to view the total number of events for an individual system, check—in the Extended Operation tab—the Event Count property of its Main Server.